Elias Turk
Data analyst | Fan of data that speak | Google certified data analyst & scientist.

Data analyst | Fan of data that speak | Google certified data analyst & scientist.


Data visualization using Tableau.
After webscraping with python and data cleaning with R, i used tableau to visualize the small data that we have.
They are separated into 3 dashboards.
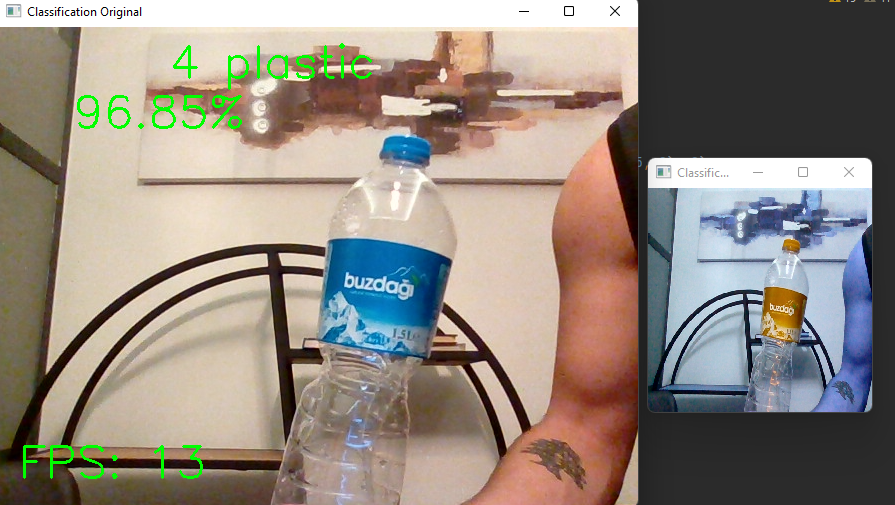
This is my master's senior project.TrashNet dataset was used in this project and it is a public
dataset that can be found on github.
Transfer learning using pre-trained models were used using tf-hub .

Data cleaning using R .
Cleaned data using several R packages like the tidyverse and saved it to a csv file .

Red wine quality analysis,visualization and predictive analysis using regression and classification algorithms in Python. Medium article link can be found inside repository.

World happiness is all about prosperity and economic growth.
During this project,i cleaned and merged 2 datasets together and shared it on Kaggle. I also
built visualizations and predictive models.
Cleaned and merged dataset can be found on Kaggle.

This is a data visualization project associated with the world happiness project .
It showcases some interesting insights about world happiness from year 2015 to 2020.
Please note : This dashboard is made from my own dataset published on Kaggle and can be found in
the previous project.

This is how i scraped a shopify e-clothing store using selenium in python .
It dumps data and put them in a dataframe which we later on saved it to csv.
This is a data exploratory project using SQL queries .
It displays interesting facts about covid .

This is a data visualization project associated with the COVID-19 project .
It displays interesting facts about covid in a visualized way.
Please note : Queries used for this visualization are commented at the end of the github SQL
code.
This analysis is the capstone project for the google data analyst professional certificate. .
Data transformation was conducted in MS SQL Server and visualized in PowerBi as devoted.
These are my first data visualizations in PowerBi,i'm currently expanding my skills!